
GINI Coefficient:
- It is the statistical measure used to determine the income distribution among the country’s population.
- It expresses economic inequality amongst the population.
- The GINI coefficient ranges from 0 to 1
- GINI coefficient 0 represents perfect equality and 1 represents perfect inequality.
- Higher index indicates greater inequality, with high income individuals receiving much larger percentages of the total income of the population.
Understanding The Lorenz Curve:
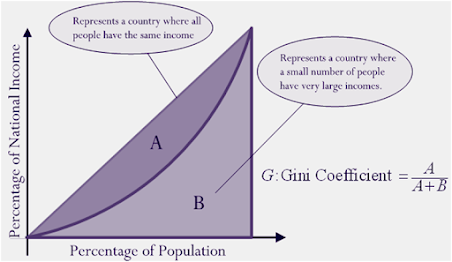
- The Gini index is calculated as the ratio of the area between the perfect equality line and the Lorenz curve (A) divided by the total area under the perfect equality line (A + B).
- Lorenz Curve plots cumulative % of population against cumulative % of income.
Interpretation of the curve:
If A=0;
G=0/0+B
=0 ie perfect equality
If B=0 ;
G=A/A+0
=1 ie perfect inequality
Further extrapolation of Lorenz Curve:

For understanding:
- If G.C <.5------------lower inequality
Ex. East Asian Countries, Scandinavian Countries
- If G.C. >.5 -----------Higher Inequality
Ex. Latin American countries, Mexico,USA.
World inequality Report 2022:
- The top 1% of the population hold more than one-fifth of the total national income in 2021 and the bottom half just 13%.
- LPG Reforms adopted by India in 1991 have benefitted mostly the Top 1 % of the population.
Link between Economic Growth and income inequality :
Period 1951-81----------------
Period of Lower GDP growth rate
&
Lower income inequality
Higher GDP Growth
&
Higher Income Inequality
&
Lower Poverty


